Competition Data Observatory

Our observatory is monitoring the certain segments of the European economy, and develops tools for computational antitrust in Europe. We take a critical SME-, intellectual property policy and competition policy point of view automation, robotization, and the AI revolution on the service-oriented European social market economy.
We aim to create early-warning, risk, economic effect, and impact indicators that can be used in scientific, business and policy contexts for professionals who are working on re-setting the European economy after a devastating pandemic and in the age of AI. We would like to map data between economic activities (NACE), antitrust markets, and sub-national, regional, metropolitian area data.
Visit the Competition Data Observatory
Try the Competition Data Observatory API
Finding reliable historic and new data that can fuel large market monitoring schemes or computational antitrust models is surprisingly hard. And it is even more hopeless if you work as a (data) journalist, a policy researcher in an NGO, or in a competition law practice that does not provide you with an army of (geo)statisticians, data engineers, and data scientists who can render various data into usable format, i.e. something that you can trust, quote, visualize, import, or copy & paste.
Better, Bigger, Faster, More
Get more information from public datasets, or data you had paid for. Find more data in higher quality that is available sooner than in other sources.
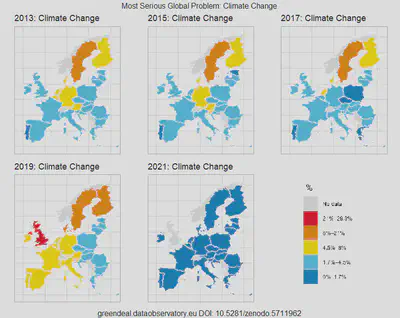 | Official statistics at the national and European levels follow legal regulations, and in the EU, compromises between member states. New policy indicators often appear 5-10 years after demand appears. We employ the same methodology, software, and often even the same data that Eurostat might use to develop policy indicators, but we do not have to wait for a political and legal consensus to create new datasets. See our 100,000 Opinions on the Most Pressing Global Problem blogpost. |
 | Statistical agencies, old fashioned observatories, and data providers often do not have the mandate, know-how or resources to improve data quality. Using peer-reviewed statistical software and hundreds of computational tests, we are able to correct mistakes, impute missing data, generate forecasts, and increase the information content of public data by 20-200% percent. This makes the data usable for NGOs, journalists, and visual artists—among other potential users—who do not have this statistical know-how to make incomplete, mislabelled or low quality data usable for their needs and applications. See our example with the Turnover of the Radio Broadcasting Industry in Europe indicator. |
 | The 2019/1024 directive on open data and the re-use of public sector information of the European Union (which is an extension and modernization of the earlier directives on re-use of public sector information since 2003) makes data gathered in EU institutions, national institutions, and municipalities, as well as state-owned companies legally available. According to the European Data Portal the estimated historical cost of the data released annually is in the billions of euros. But if this data is a gold mine, its full potential can only be unlocked by an experienced data mining partner like Reprex. Here is why: data is not readily downloadable; it sits in various obsolete file formats in disorganized databases; it is documented in various languages, or not documented at all; it is plagued with various processing errors. We make the powerful promise Government Budget Allocations for R&D in Environment of the EU legislation a reality in the field of the Green Deal policy context. |
Increase Your Impact, Avoid Old Mistakes
Reprex helps its policy, business, and scientific partners by providing efficient solutions for necessary data engineering, data processing and statistical tasks that are as complex as they are tedious to perform. We deploy validated, open-source, peer-reviewed scientific software to create up-to-date, reliable, high-quality, and immediately usable data and visualizations. Our partners can leave the burden of this task, share the cost of data processing, and concentrate on what they do best: disseminating and advocating, researching, or setting sustainable business or underwriting indicators and creating early warning systems.
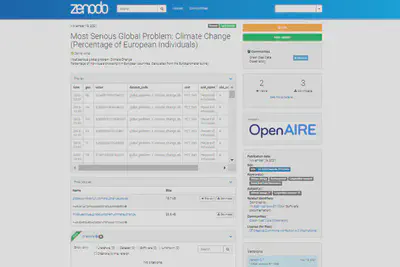 | We publish the data in a way that it is easy to find—as a separate data publication with a DOI, full library metadata, and place it in open science repositories. Our data is more findable than 99% of the open science data, and therefore makes far bigger impact. See our data on the European open science repository Zenodo managed by CERN (the European Organization for Nuclear Research). |
 | Our data follows the tidy data principle and comes with all the recommended Dublin Core and DataCite metadata. This increases our data compatibility, allowing users to open it in any spreadsheet application or import into their databases. We publish the data in tabular form, and in JSON form through our API enabling automatic retrieval for heavy users, especially if they plan to automatically use our data in daily or weekly updates. Using the best practice of data formatting and documentation with metadata ensures reproducibility and data integrity, rather than repeating data processing and preparation steps (e.g. changing data formats, removing unwanted characters, creating documentation, and other data processing steps that take up thousands of working hours. See our blogpost on the data Sisyphus. |
Ethical Big Data for All
Big data creates inequalities, because only the largest corporations, government bureaucracies and best endowed universities can afford large data collection programs, the use of satellites, and the employment of many data scientists. Our open collaboration method of data pooling and cost sharing makes big data available for all.
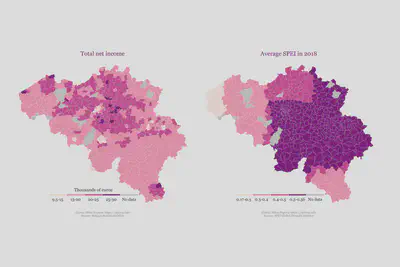 | Integrating and joining data is hard—it requires engineering, mathematical, and geo-statistical know-how that a large amount of environmental users and stakeholders do not possess. Some examples of the challenges implicit in making data usable include addressing the changing boundaries of French departments (and European administrative-geographic borders, in general), various projections of coordinates on satellite images of land cover, different measurement areas for public opinion and hydrological data, public finance expressed in different orders (e.g. millions versus thousands of euros). We create data that is easy to combine, map, and visualize for end users. See our case study on the severity and awareness of flood risk in Belgium, as well as the financial capacity to manage it. |
 | AI in 2021 increases data inequalities because large government and corporate entities with an army of data engineers can create proprietary, black box business algorithms that fundamentally alter our lives. We are involved in the R&D and advocacy of the EU’s trustworthy AI agenda which aims at similar protections like GDPR in privacy. We want to demystify AI by making it available for organizations who cannot finance a data engineering team, because 95% of a successful AI is cheap, complete, reliable data tested for negative outcomes – precisely what dwe offer to our users. |
Open Collaboration
Reprex grew out of an international data cooperation and works in the open-source world. We use the agile open collaboration method that allows us to work with large corporations, NGOs, developers, university researcher institutes and individuals on an equal footing.
Competition Data Observatory
A forming new open collaboration for computational antitrust
A fully automated, open source, open data observatory that produces new indicators from open data sources and experimental big data sources, with authoritative copies and a modern API.