New Indicators for Computational Antitrust
Introducing Our Data Curators

As someone who’s worked in data for almost 20 years, what type of data do you usually use in your research?
In my field (industrial organisation, competition policy), company level financial data, and product price and sales data have been the conventional building blocks of research papers. Ideally this has been the sort of data that I would seek out for my work. Of course as academic researchers we often get knocked back by the reality of data access and availability. I would think that industrial organisation is one of those fields where researchers have to be quite innovative in terms of answering interesting and relevant policy questions, whilst having to operate in an environment where most relevant data is proprietary and very expensive. Against this backdrop, I have worked with neatly organised proprietary datasets, self-assembled data collections, and also textual data.
From your experience working with various data sets, models, and frameworks, what would be the ultimate dataset, or datasets that you would like to see from the Economy Data Observatory?
There seems to be an emerging consensus that market concentration and markups have been continuously increasing across the economy. But most of these works use industry classification to define markets. One of the things I’d really like to see coming out of the Economy Data Observatory is a mapping of what we call antitrust markets.
Available datasets use standard industry classification (such as NACE in the EU), which is often very different from what we call a product market in microeconomics. Product markets are defined by demand, and supply-side substitutability, which is a dynamically evolving feature and difficult to capture systematically on a wider scale. But with the recent proliferation of data and the growth (and fall in price) of computing power, I am positive that we could attempt to map out the European economy along these product market boundaries. Of course this is not without any challenge. For example in digital markets, traditional ways to define markets have caused serious challenges to competition authorities around the world.
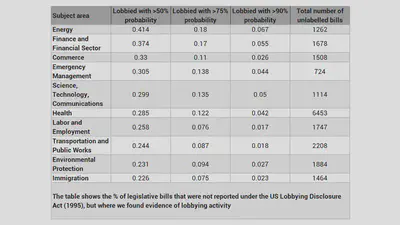
I believe that there is an immensely rich, and largely unexplored source of information in unstructured textual data that would be hugely useful for applied microeconomic works, including my own area of IO and competition policy. This includes a large corpus of administrative and court decisions that relate to businesses, such as merger control decisions of the European Commission. To give two examples from my experience, we’ve used a large corpus of news reports related to various firms to gauge the reputational impact of European Commission cartel investigations, or we’ve trained an algorithm to be able to classify US legislative bills and predict whether they have been lobbied or not. Finding a way to collect and convert this unstructured data into a format that is relevant and useful for users is not a trivial challenge, but is one of the most exciting parts of our Economy Data Observatory plans (see related project plan).
What is an idea that you consider will be a game changer for researchers and/or policymakers?
Partly talking in the past tense, the use of data driven approaches, automation in research, and machine learning have been increasingly influential and I think this trend will continue to all areas of social science. 10 years ago, to do machine learning, you had to build your models from scratch, typically requiring a solid understanding of programming and linear algebra. Today, there are readily available deep learning frameworks like TensorFlow, Keras, PyTorch, to design a neural network for your own application. 10 years ago, natural language processing would have only been relevant for a small group of computational linguists. Today we have massive word embedding models trained on an enormous corpus of texts, at the fingertip of any researcher. 10 years ago, the cost of computing power would have made it prohibitive for most researchers to run even relatively shallow neural networks. Today, I can run complex deep learning models on my laptop using cloud computing servers. As a result of these developments, whereas 10 years ago one would have needed a small (or large) research team to explore certain research questions, much of this can now be automated and be done by a single researcher. For researchers without access to large research grants and without the ability to hire a research team, this has truly been an amazing victory for the democratisation of research.

Do you have a favorite, or most used open governmental or open science data source? What do you think about it? Could it be improved?
As a competition economist, I tend to need very specific data for each research question I’m working on, which has to be collected from scratch. On the other hand, most works do require us to use data that has already been collected and made available. For example, access to census data has been immensely useful in ensuring that we can control for local demographic features, in papers where local competition plays a role. Census data is made readily available by most governments, but I particularly liked the Australian data, partly because they run a census every 5 years, but also because they have made the data available through a great table making tool.
Is there a number that recently surprised you? What was it?
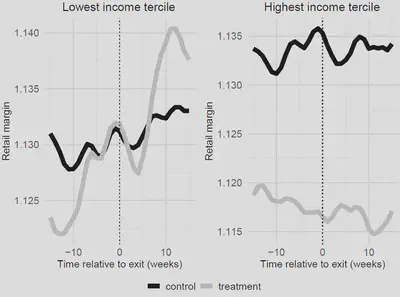
I have these moments of surprise fairly frequently. To give one example from something I’m currently working on, looking at the distributional impact of increasing market concentration, we’ve found that low income households experience a larger increase in the petrol retail margin when market concentration increases than high income households. This fits nicely with theoretical works on search in homogeneous costs, i.e. low income households are less good at engaging with the market, and, as a result, if suppliers can price discriminate, they will charge a higher margin to these households.
The figure below shows our raw data (18 years of petrol station level daily price data from Western Australia) for low and high income areas, and the increase in the margin following an increase in market concentration (vertical dotted line). The left hand side, low income areas, displays a large increase in the margin (when compared to a control group), whereas the right hand side (high income households) experience no change. In our paper of course we build a fairly data intensive quasi experiment for identification of the treatment effect of changing market concentration on the price margin applied to various demographic groups.
Do you have a good example of really good, or really bad use of data science /data curation?
Out of professional courtesy I really wouldn’t like to mention names from academic research as examples of bad use of data. But there are ample examples from newspaper coverage of data related work, or simply the misuse of data by newspapers. This may be intentional but is often a result of journalists not having the necessary training in using and analysing data.
When the press finds a piece of academic research interesting, often bad things come out of it. This is often because not all journalists are well equipped to interpret scientific findings. As a result, sometimes conclusions are drawn as a result of a misinterpretation of good data analysis. Correlation interpreted as causation is a frequently recurring example. Equally bad is press coverage changes the incentive system of producing good research, when scientists work too hard for their work to be noticed by the press, and sacrifice scientific rigour in data analysis for the sake of media attention. There can also be less discernible but equally damaging errors.
In some cases requiring to pre disclose the tests the research is going to run on data helps maintain credibility in many instances. Moreover, I am always a bit suspicious if the authors do not give access to their data for reproduction.

What do you see as the greatest challenge with open data in 2021?
The things I mentioned above about the democratisation of research driven by automation and access to big data does raise serious challenges as well. The obvious one is to do with the fact that there are enormous economies of scale in the use of data. As such, larger players will always be better positioned to outdo their smaller competitors, simply as a result of their superior data and infrastructure (for example having more granular consumer data allowing them to offer better designed customised experience for the consumer). Like many others, I see this as the biggest challenge for open data - to level the playing field for smaller players. This is not a trivial task at all; and even if, miraculously, small businesses could access the same data as the biggest players, they still would not have the capacity or the ability to use this data. So allowing access to data alone is unlikely to solve any of these problems. I would say that fostering engagement with open data is probably as big a challenge as creating the open data in the first place.
How do you envision the Economy Data Observatory making open data more credible in the European economic policy community and accepted as verified information?
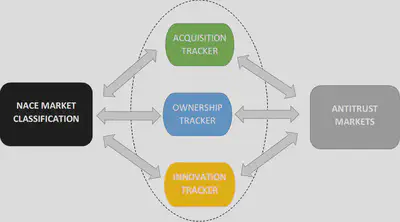
I think starting with a focused agenda is a good idea. For example, linking up with the Centre for Competition Policy means that we have an initial focus of competition policy relevant economic data. This is still a large domain, but it is one where we have ample expertise. Starting with specific research questions such as linking competition enforcement and merger decisions to related information on innovation and ownership data puts the Economy Data Observatory at the heart of some of the most topical policy questions, such as the role of killer acquisitions (acquisitions with the intent to kill of sources of rival innovation), or common ownership, both of which are increasingly discussed in policy and practitioner circles. Once we established ourselves as a credible source of data in the competition policy community, we can look into joining this up with other policy areas, and also with our other Data Observatories (Music and Green Deal).
, [developer](/authors/developer) or [business developer](/authors/team), or share your data in our public repository [Economy Data Observatory on Zenodo](https://zenodo.org/communities/economy_observatory/)](/img/observatory_screenshots/edo_and_zenodo.png)
Join us
Join our open collaboration Economy Data Observatory team as a data curator, developer or business developer. More interested in environmental impact analysis? Try our Green Deal Data Observatory team! Or your interest lies more in data governance, trustworthy AI and other digital market problems? Check out our Digital Music Observatory team!